
Aviation · Airport construction · Airline operations
Illustrative scenario · synthetic data · not client work
Airside Reliability During Phased Terminal Construction
At a fictional Northeast hub, terminal construction shuts power, relocates jet bridges and closes gates. This scenario shows how sensor data, technician notes and the construction calendar catch more bridge failures with the same crew, and why the phasing plan, not a smarter gate algorithm, decides how long aircraft wait.
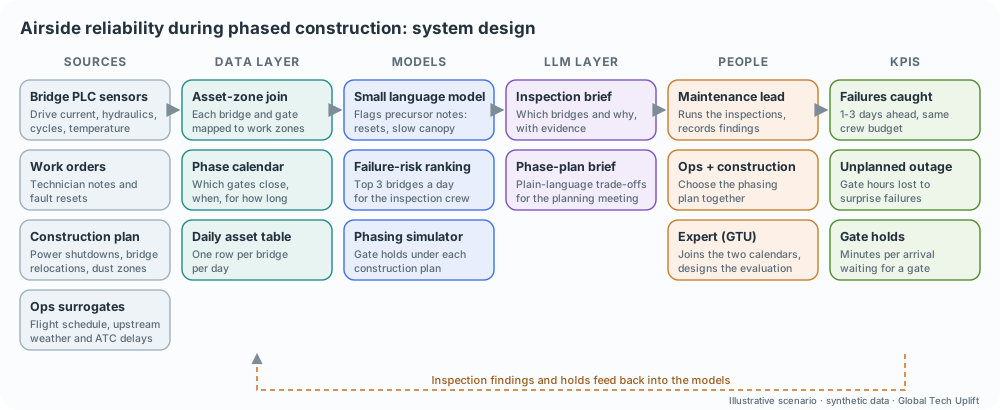
- Sense
- Join
- Rank
- Simulate
- Decide
- Recover
What the scenario shows
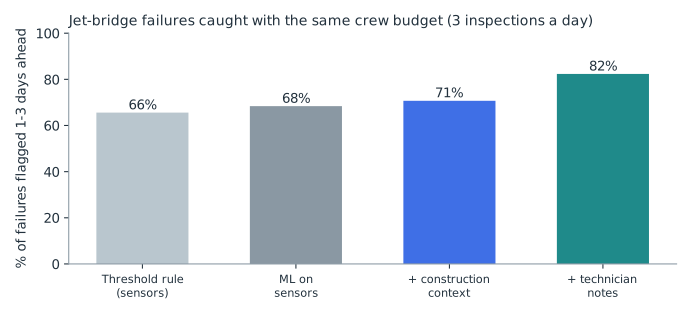
- With the same crew budget of 3 inspections a day, failures caught 1-3 days ahead rise from 66% to 82% .
- Unplanned gate outage falls from about 82 to 62 hours over nine months (stated assumptions).
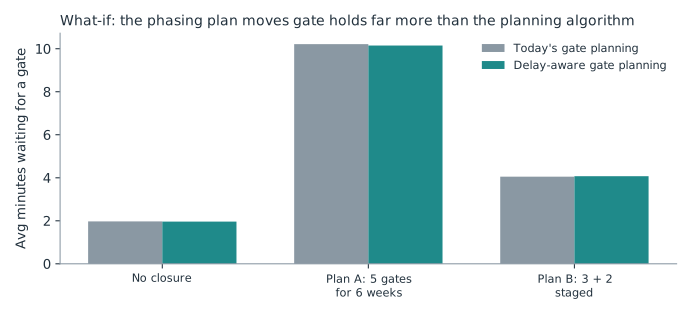
- Staging the gate closures cuts average gate waits from 10.2 to 4.0 minutes per arrival; a smarter gate planner barely moved it.
- Everything here is synthetic and labelled as such.
The scenario (fictional)
- A fictional Northeast hub airport is in Phase 2 of a terminal redevelopment. A hub airline operates 40 contact gates with 36 passenger boarding bridges (jet bridges).
- The general contractor's tie-in work needs planned power shutdowns, relocates several bridges and raises dust next to one concourse.
- Bridge failures cluster near the work zone. Each surprise failure takes a gate out for hours and pushes aircraft to wait or tow. The airline, the airport and the contractor each see part of the problem.
Stakeholders
- Airline operations control: gate plan and on-time performance.
- Bridge maintenance (airport or vendor): a crew that can inspect about three bridges a day.
- Construction program manager and GC: phasing, shutdown windows, relocations.
- Airport planning: approves which gates close and when.
- Airline and airport technology teams: own the data platforms and the existing optimisers.
What they had already tried (typical pilots)
- Vendor threshold alarms on bridge controller data: they catch wear-out failures that drift slowly, and miss sudden ones.
- A gate-assignment optimiser: strong in normal operations, built without the construction calendar.
- A chat assistant over maintenance manuals: helpful for technicians, but it does not say which bridge to inspect today.
Pinpointing the problem space (why)
- Two departments, two calendars. Maintenance data and the construction schedule live in different systems, so nobody sees that failures follow shutdowns and relocations.
- Sudden failures leave no sensor trace. Electrical surges after tie-ins and faults after relocation often happen without drift, so sensor-only models miss them.
- Technicians notice first. 'Drive fault reset, intermittent' or 'canopy slow to deploy' in a work order is often the earliest warning.
- It is a ranking problem under a budget. The crew can inspect only three bridges a day, so the question is which three.
- Gate waits are mostly decided months earlier, when planners choose how many gates close at once.
Data explored
| Source | What it adds | Signal type |
|---|---|---|
| Bridge controller sensors | Drive current, hydraulics, cycles | Direct, noisy, temperature-sensitive |
| Work orders and technician notes | Resets, slow canopy, noises | Weak, early |
| Construction calendar | Shutdowns, relocations, dust zones | Context, from another department |
| Flight schedule and delay forecasts | Demand on each gate | Operational |
| Upstream airport weather and ATC programs | Likely arrival delays | Surrogate |
Plan (six to eight weeks)
- Join the calendars: map each bridge and gate to construction work zones and the phase plan.
- Read the notes: a small language model flags precursor phrases in work orders, trained on 500 labelled notes.
- Rank bridges daily: a failure-risk model picks the top 3 bridges for inspection, tested on the last nine months against the vendor thresholds with the same budget.
- Simulate the phasing: a what-if model of gate waits under each construction plan, built with operations and construction together.
- Deliver it: an LLM writes the daily inspection list with reasons, and a plain-language comparison of phasing options for the planning meeting.
What was done (synthetic data)
- Simulated two years of daily data for 36 bridges with wear-out drift, construction stress (shutdowns, relocations, dust) and technician notes.
- Trained a small text classifier on labelled notes (93% accuracy on held-out notes) and failure-risk models on 15 months, tested on the last 9.
- Simulated 98 days of gate operations (360 arrivals a day, 40 gates, weather days) under three phasing plans, with today's planning and with a delay-aware planner.
- The LLM briefs are part of the design; they were not evaluated here.
How each AI piece is used
| Piece | Role in this scenario | In this study |
|---|---|---|
| Weak signals | Technician notes such as resets and a slow canopy | Tested: 12 more points of failures caught |
| Construction context | Shutdown, relocation and dust calendar joined to each bridge | Tested: 2 more points over sensors alone |
| Surrogate data | Upstream airport weather and ATC delays, to forecast arrival delays | Tested in the gate planner: no material effect |
| Small language model | Flags precursor phrases in work orders | Stand-in classifier, 93% on held-out notes |
| Predictive model | Ranks bridges daily under the crew's inspection budget | Tested on the last nine months |
| Simulation | Gate waits under each construction phasing plan | Tested: 98 simulated days per plan |
| Large language model | Daily inspection list with reasons; phasing brief for the planning meeting | Design only, not evaluated |
| Agentic workflow | Keeps the asset-to-zone join and phase calendar current, assembles the daily list | Design only, not evaluated |
Outcomes (synthetic data)
| KPI | Threshold rule | ML on sensors | + construction context | + technician notes |
|---|---|---|---|---|
| Failures caught 1-3 days ahead | 66% | 68% | 71% | 82% |
| Unplanned outage, hours per 9 months* | 82 | 79 | 76 | 62 |
| Inspections that find a developing fault | 4% | 5% | 5% | 6% |
| Phasing plan | Avg minutes waiting for a gate | Arrivals held per day | With delay-aware planner |
|---|---|---|---|
| No closure (reference) | 2.0 | 65 | about the same |
| Plan A: close 5 gates for 6 weeks | 10.2 | 133 | 10.1 min |
| Plan B: 3 gates, then 2 more | 4.0 | 95 | about the same |
*Assumes 6 hours of gate outage per surprise failure and 1.5 hours for a planned repair. About 27 failures in the nine-month test period.
Where AI helps, and where an expert is needed
| AI does well | An expert decides |
|---|---|
| Ranks 36 bridges every day under a crew budget | Joining maintenance data to the construction calendar, which no single department owns |
| Reads every work order for early warnings | Setting the budget and an honest test: same crew, later months, vendor rule as the baseline |
| Simulates gate waits under each plan | Seeing that the optimiser is not the bottleneck and taking the phasing choice to the planning meeting |
| Writes the daily list and the phasing brief | Explaining trade-offs to airline, airport and contractor in one room |
Questions to ask in the room
- Do your maintenance and construction teams share a calendar? If not, failures after shutdowns look random when they are not.
- How many bridges can your crew inspect a day, and how do you choose which? The answer frames the model as a ranking with a budget.
- When you plan gate closures, do you simulate the waits? In this scenario, staging closures halved gate waits; a better algorithm did not.
- Where do technicians write what they notice? Those notes are often the earliest warning in the building.
About this scenario
This is an illustrative scenario built on synthetic data generated for this page. The airport, airline, contractor and figures are fictional. The method, code and assumptions are available on request.
Next step
A similar problem on your side?
A free 30-minute discovery call for your team.