
Construction · New York City · Subcontractor operations
Illustrative scenario · synthetic data · not client work
Early Warning for Margin Fade on NYC Mechanical Jobs
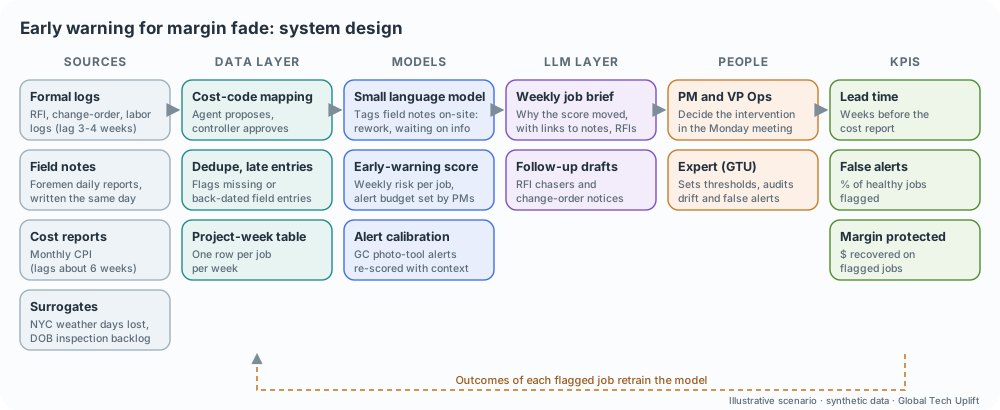
A fictional NYC mechanical subcontractor learns about money-losing jobs from the monthly cost report, about six weeks too late. This scenario shows how field notes, logs and a small language model raise the alarm weeks earlier, and where expert judgment decides what is worth acting on.
- Notes
- Signals
- Score
- Brief
- Decide
- Recover
What the scenario shows
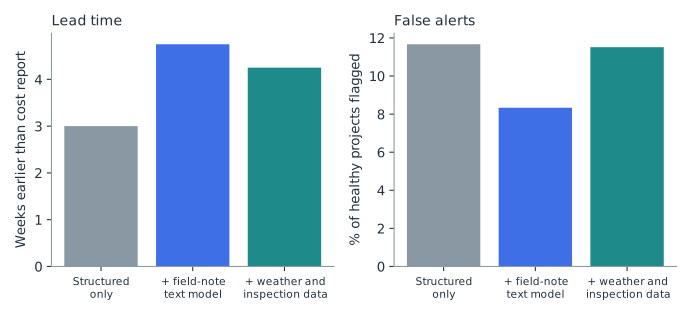
- Weak-signal score flags losing jobs a median 4.8 weeks before the cost report, versus 3.0 weeks from formal logs alone.
- False alerts on healthy jobs fall from 12% to 8% once field-note text is added.
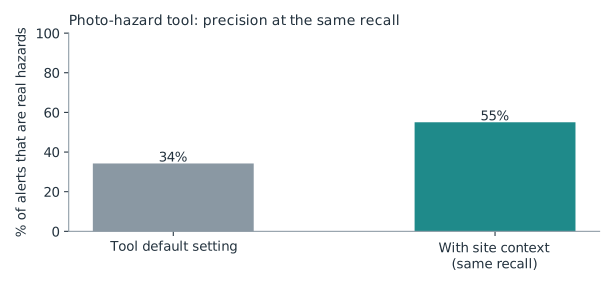
- Photo-hazard tool alerts: precision rises from 34% to 55% at the same recall, cutting weekly alerts from 27 to 16.
- Everything here is synthetic and labelled as such.
The scenario (fictional)
- Harbor Line Mechanical (fictional): a NYC mechanical subcontractor, about $90M a year, roughly 40 active HVAC, plumbing and fire-protection jobs across Manhattan and Brooklyn.
- Three or four jobs a year lose 4 to 9 points of margin. Each time, the loss is recognised when the monthly cost report shows the cost performance index below 0.95, by which point most of the damage is done.
- Their general-contractor customers have rolled out AI: a photo-based hazard tool on site and company-wide chat assistants. The subcontractor is asked to plug in, and the CFO wants to know what is actually worth it.
Stakeholders
- Owner and CFO: margin and cash; wants fewer surprises at month end.
- VP Operations and project managers: run 6 to 10 jobs each; drowning in RFIs, change orders and daily reports.
- Field foremen: write the daily notes nobody has time to read.
- Safety director: receives the GC photo tool's alerts.
- Estimating lead: wants the lessons from losing jobs in the next bid.
What they had already tried (typical pilots)
- A chat assistant for drafting RFIs and emails: useful for writing, but it predicts nothing.
- The GC's photo-hazard tool: about 27 alerts a week across four sites, only a third of them real hazards. The safety team stopped reading them.
- Dashboards in the project-management system: they show cost performance, which lags reality by about six weeks.
Pinpointing the problem space (why)
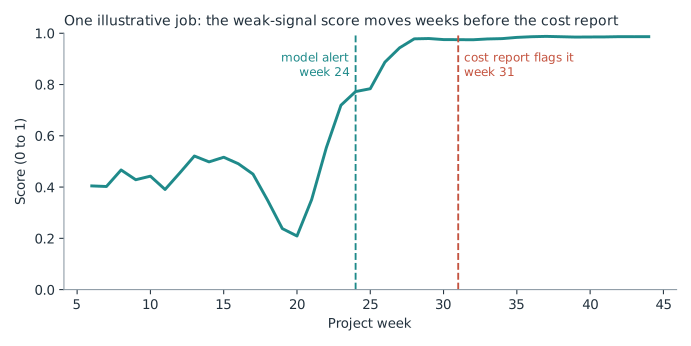
- The cost report is a lagging signal. Costs are coded late and reported monthly, so trouble that starts in week 20 shows up around week 26 or later.
- Formal logs lag too. RFI, change-order and labor logs are updated three to four weeks after the fact.
- The earliest evidence is unstructured. Foremen write 'crew standing by, waiting on RFI response' and 'redo of duct after design change' the same day. That text is the weak signal.
- Confounds create false alarms. Rain days inflate idle hours and late deliveries on every job, healthy or not. Temporary access problems look like trouble but resolve.
- Data is messy. Cost codes differ across jobs and field entries arrive late, so any model needs a clean data layer first.
Data explored
| Source | What it adds | Signal type |
|---|---|---|
| Daily-report field notes | Rework, unanswered questions, blocked access, inspection waits | Weak, early (same day) |
| RFI and change-order logs | Volume, age, value pending | Formal, lags 3-4 weeks |
| Labor hours versus plan | Productivity drift | Formal, lags 3 weeks |
| Monthly cost report (CPI) | The official verdict | Lagging, about 6 weeks |
| NYC weather days lost | Explains idle hours and late deliveries | Surrogate |
| City inspection backlog | Explains inspection waits | Surrogate |
| GC photo-hazard alerts | Safety signal, noisy | Vendor model output |
Plan (six weeks)
- Weeks 1-2, data layer: an agent proposes a common cost-code mapping across jobs; the controller approves each mapping. Late and duplicate field entries are flagged.
- Weeks 2-3, field-note model: 500 notes labelled by a PM and a foreman; a small language model tags notes on-site (no data leaves the company).
- Weeks 3-4, early-warning score: a weekly risk score per job, trained on past jobs and tested on later ones. PMs choose the alert budget: no more than 1 in 10 healthy jobs flagged.
- Weeks 4-5, evaluate the GC tool: the safety director reviews a sample of 500 alerts; alerts are re-scored with site context (crane activity, occupied building, weather, time of day).
- Weeks 5-6, into the workflow: an LLM writes a one-paragraph brief per flagged job, with links to the notes and RFIs behind it, for the Monday operations meeting.
What was done (synthetic data)
- Generated 12 synthetic portfolios of 120 jobs each, with formal logs lagging, notes written the same day, weather confounds and temporary problems on healthy jobs.
- Trained a small text classifier on labelled notes (93% accuracy on held-out notes) as a stand-in for an on-site small language model.
- Trained the weekly early-warning model on the first 90 jobs and tested on the last 30, with the alert threshold set on held-out training jobs.
- Compared three versions: formal logs only, plus field-note text, plus weather and inspection data.
- The LLM brief is part of the design; it was not evaluated here.
How each AI piece is used
| Piece | Role in this scenario | In this study |
|---|---|---|
| Weak signals | Foremen's same-day notes about rework and unanswered questions | Tested: adds about 1.8 weeks of warning |
| Surrogate data | NYC weather days lost and city inspection backlog, to explain confounds | Tested: no extra lead time here, so left out |
| Small language model | Tags field notes on-site, so job data stays private | Stand-in classifier, 93% on held-out notes |
| Predictive model | Weekly early-warning score per job, under an alert budget | Tested on later jobs than it learned from |
| Large language model | Weekly job brief with links to evidence; RFI follow-up drafts | Design only, not evaluated |
| Agentic workflow | Proposes cost-code mappings and flags late entries; a person approves | Design only, not evaluated |
Outcomes (synthetic data)
| KPI | Formal logs only | + field-note text | + weather, inspections |
|---|---|---|---|
| Median lead time before the cost report | 3.0 weeks | 4.8 weeks | 4.2 weeks |
| Healthy jobs falsely flagged | 12% | 8% | 12% |
| Margin protected on 30 test jobs* | $0.71M | $0.78M | $0.77M |
| Margin lost on those jobs (all versions) | $2.64M | $2.64M | $2.64M |
*Assumes a flagged job recovers 35% of the margin it had not yet lost. Photo-hazard tool: precision 34% to 55% at the same 64% recall; alerts a week 27 to 16.
Where AI helps, and where an expert is needed
| AI does well | An expert decides |
|---|---|
| Reads thousands of field notes a week and tags them | Which signals lead and which lag, and why the cost report cannot be the alarm |
| Ranks jobs by risk every week | The alert budget, set with PMs so alerts stay credible |
| Drafts the weekly brief and RFI follow-ups | Dropping data that does not help: here, weather added no lead time, so it stays out |
| Re-scores a vendor tool's alerts | Testing the vendor tool on a human-reviewed sample instead of trusting its accuracy claim |
| Turning an alert into an intervention: who calls the GC, what gets re-sequenced |
Questions to ask in the room
- When did you last find out a job was losing money: from the field or from the cost report? If the cost report, there is usually four to six weeks of warning sitting in daily notes.
- How many alerts does your safety tool send a week, and how many are real? If nobody knows, start with a 500-alert review; it usually reveals easy precision gains.
- What would you do differently with five weeks' notice on a job going bad? If the answer is nothing, fix the playbook before buying a model.
- Do your cost codes mean the same thing on every job? If not, that is week one of any AI project.
About this scenario
This is an illustrative scenario built on synthetic data generated for this page. The company, jobs and figures are fictional. The method, code and assumptions are available on request.
Next step
A similar problem on your side?
A free 30-minute discovery call for your team.